
How to Identify Bull Market Signals: A Practical Guide for Crypto Investors
You stare at the chart. The price is ticking up, but is this the start of a real run, or just another trap? Every crypto trader has been there. You buy, it drops, you sell in frustration, and then it rockets without you. Identifying bull market signals isn't about guessing; it's about spotting specific patterns that tell you the tide is turning. Whether you're trading Bitcoin on Binance or analyzing altcoins on CoinMarketCap, knowing how to read these signs can save your portfolio from unnecessary losses and help you catch the big moves early.
The Golden Cross: Your First Big Flag
If you only learn one technical indicator, make it the moving average crossover. Specifically, watch the 50-day Moving Average and the 200-day Moving Average. When the shorter-term average (50-day) crosses above the longer-term average (200-day), analysts call this a "Golden Cross." It’s not magic, but it works because so many traders watch it. This crossover suggests that recent buying pressure is stronger than long-term selling pressure. Historically, this signal has preceded significant rallies in both traditional stocks and major cryptocurrencies like Ethereum. However, don't act on the cross alone. Wait for confirmation. A single day of closing above the line isn't enough. Look for sustained momentum over several days.
| Indicator | Bullish Signal | Confirmation Needed |
|---|---|---|
| Moving Averages | 50-day MA crosses above 200-day MA | Price closes above both lines for 3+ days |
| Relative Strength Index (RSI) | RSI breaks above 50 and stays below 70 | Increasing positive divergence |
| Volume | Spike in volume during price breakout | Volume remains elevated on subsequent gains |
| MACD | MACD line crosses above signal line | Histogram turns green and expands |
Volume Doesn't Lie: Confirming the Breakout
Price movement without volume is like a car without an engine-it might roll downhill, but it won't climb uphill for long. Genuine bull market breakouts are almost always accompanied by a surge in trading volume. If Bitcoin breaks a key resistance level at $60,000 but the volume is lower than the previous week, be skeptical. That's often a "bull trap," where whales push the price up to lure retail investors before dumping their bags. Conversely, if you see a sharp price increase paired with a massive spike in volume, it indicates strong institutional interest. In crypto, check exchange-specific volume data rather than just aggregated numbers, as wash trading can sometimes inflate global stats. Tools like TradingView allow you to overlay volume bars directly on your candlestick charts, making this correlation easy to spot visually.
The 18-Day Rule: A Historical Edge
Here is a specific, data-backed strategy that many professional traders use. It’s called the "18 consecutive closes" rule. Backtesting historical data shows that when an asset closes above its 200-day Simple Moving Average (SMA) for 18 consecutive trading days after being in a bear market, it often leads to substantial returns. One study noted an average return of over 21% within a year of this signal triggering. Why 18 days? It filters out short-term volatility and noise. A single day above the average could be a fluke. Eighteen days show persistence. While this metric was originally popularized in stock markets, it translates well to major cryptocurrencies with high liquidity. Keep a calendar handy. If you notice the trend holding steady above the long-term average for nearly three weeks, the probability of a sustained bull run increases significantly.

Reading Sentiment: Fear, Greed, and Social Buzz
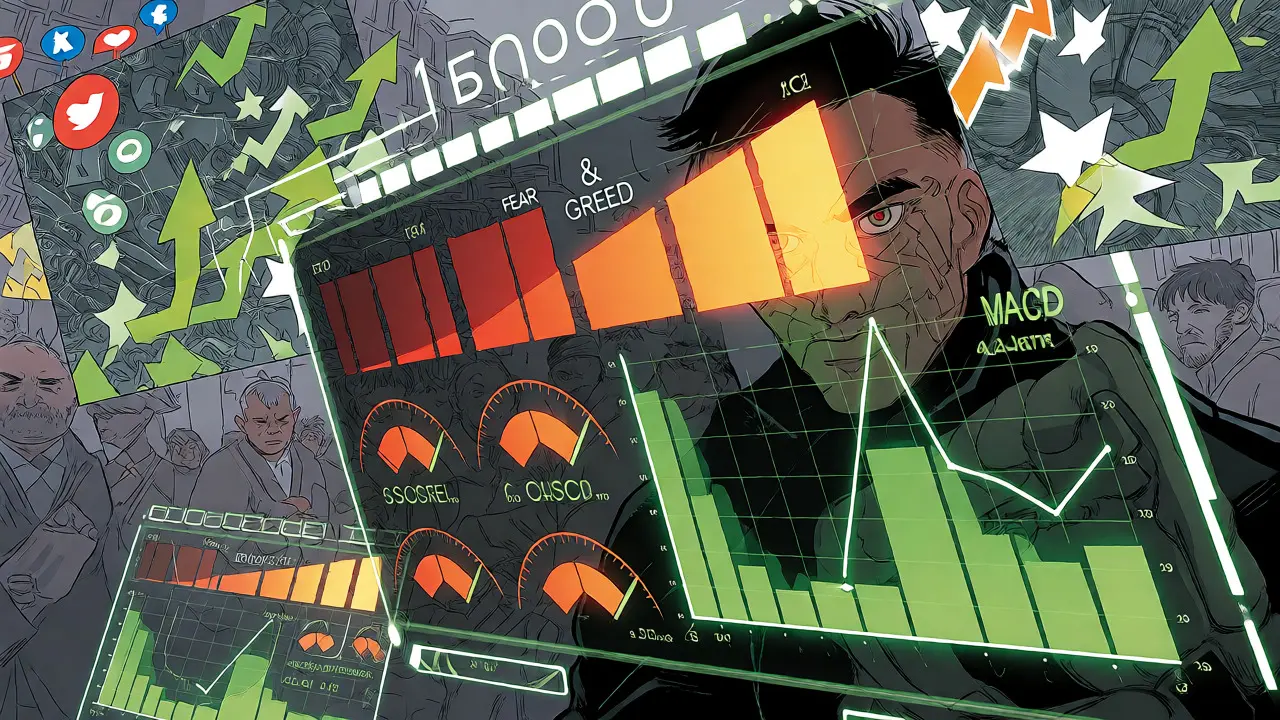
Markets are driven by people, and people are emotional. The Crypto Fear & Greed Index is a free tool that aggregates social media sentiment, volatility, and dominance metrics into a single score from 0 to 100. Paradoxically, some of the best times to enter a bull market are when the index reads "Extreme Fear" (below 25). As the index climbs past 50 (Neutral) and enters "Greed" territory, it confirms the bullish trend is gaining traction. But watch out for "Extreme Greed" (above 75-80). That’s often where the party ends. Additionally, monitor social media platforms like X (formerly Twitter) and Reddit. Are influencers talking about new tech upgrades or regulatory clarity? Or are they just hyping meme coins? Substantive news drives sustainable bull markets; hype drives short-term spikes. Look for a shift in narrative from "crypto is dead" to "crypto adoption is accelerating."
Fundamental Catalysts: Beyond the Chart
Technical analysis tells you *when* to buy, but fundamental analysis tells you *why*. For a bull market to sustain itself, there needs to be underlying economic strength. In crypto, this means looking at network activity. Is the number of active addresses on the blockchain increasing? Are transaction fees stabilizing or dropping due to efficiency upgrades? For example, the transition to Proof-of-Stake reduced energy consumption and staking rewards attracted institutional capital. Similarly, favorable macroeconomic conditions-like central banks pausing interest rate hikes or lowering them-inject liquidity into risk assets. When money is cheap, investors seek higher returns in volatile assets like crypto. Keep an eye on Federal Reserve announcements and inflation reports. A drop in inflation usually precedes a rise in risk appetite, creating a tailwind for digital assets.
Avoiding the Blow-Off Top
Identifying the start of a bull market is crucial, but so is recognizing when it’s ending. A "blow-off top" occurs when prices rise rapidly and vertically, disconnected from fundamentals. This phase is characterized by extreme excitement, media frenzy, and retail investors piling in late. If your taxi driver starts giving you crypto tips, it’s time to get nervous. Technically, look for the RSI staying pinned above 80 while price makes new highs. This divergence suggests momentum is fading even as price rises. Another warning sign is a failure to hold new support levels. If the price breaks a key level and immediately falls back through it, the trend may have reversed. Don’t try to catch the absolute peak. Selling a portion of your holdings as these signals appear locks in profits and protects you from the inevitable correction.
Putting It All Together: A Checklist
No single indicator is perfect. The most reliable bull market identification comes from confluence-when multiple signals align. Before entering a position, run through this mental checklist:
- Trend Confirmation: Is the price above the 200-day moving average?
- Momentum Check: Has the 50-day MA crossed above the 200-day MA (Golden Cross)?
- Volume Verification: Did the breakout occur on high volume?
- Sentiment Shift: Is the Fear & Greed Index rising from fear toward greed?
- Macro Context: Are interest rates stable or falling?
- On-Chain Activity: Are active addresses and transaction counts increasing?
If you can check four or more of these boxes, you’re likely seeing genuine bull market signals. Remember, patience pays. Waiting for confirmation reduces false positives. Use stop-loss orders to manage risk, because even the best signals can fail if black swan events occur. Stay disciplined, keep learning, and let the data guide your decisions rather than your emotions.
What defines a bull market in cryptocurrency?
A bull market is generally defined as a period where asset prices rise by 20% or more from recent lows, accompanied by optimistic investor sentiment and strong trading volumes. In crypto, this often coincides with broader economic factors like low interest rates and increased institutional adoption.
Is the Golden Cross reliable for crypto trading?
The Golden Cross (50-day MA crossing above 200-day MA) is a widely used signal, but it is a lagging indicator. It works best when confirmed by other factors like high trading volume and positive fundamental news. It should not be used in isolation for short-term trades.
How does trading volume indicate a bull market?
High trading volume during price increases confirms that buyers are aggressively entering the market, supporting the upward trend. Low volume during price rises can indicate a lack of conviction and potential for a reversal, known as a bull trap.
What is the RSI and how do I use it?
The Relative Strength Index (RSI) measures the speed and change of price movements on a scale of 0 to 100. An RSI above 50 suggests bullish momentum, while readings above 70 indicate overbought conditions, which may signal a potential pullback or end of the current rally.
Can macroeconomic factors affect crypto bull markets?
Yes, crypto assets are increasingly correlated with traditional financial markets. Factors like interest rate decisions by central banks, inflation rates, and global liquidity levels significantly impact investor risk appetite and, consequently, crypto prices.