Market Cap vs Fully Diluted Valuation: How to Compare and Use Both Metrics
Market Cap vs FDV Calculator
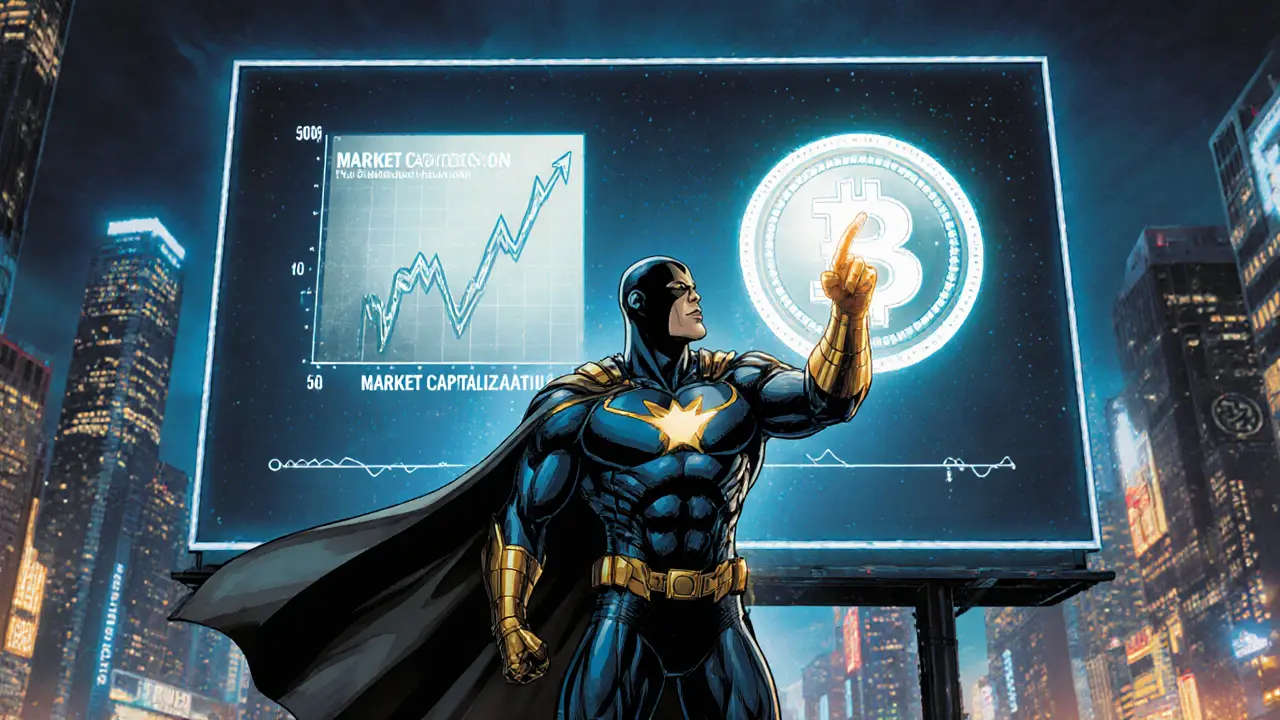
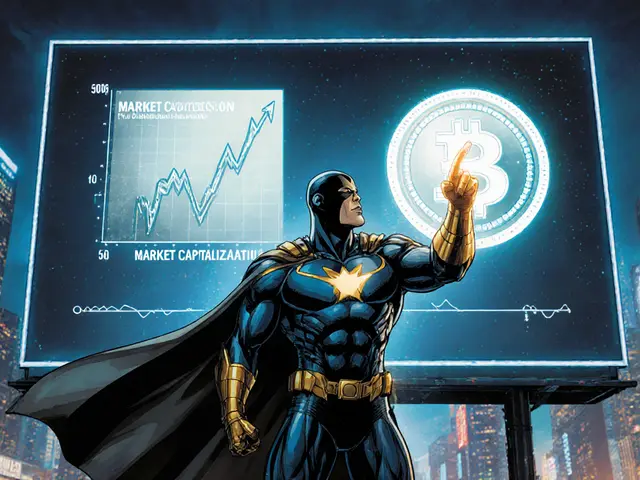
Market Capitalization
Fully Diluted Valuation (FDV)
Gap Analysis
Investors constantly ask whether a company’s or token’s price tells the whole story. The short answer: it rarely does. Two numbers-Market Cap vs Fully Diluted Valuation-appear side‑by‑side on most data sites, but most people never pause to ask what each really means. This guide strips the jargon, shows you how to calculate both figures, explains when each metric shines, and warns about the common traps that can turn a solid analysis into a costly mistake.
Key Takeaways
- Market Capitalization reflects the value of shares or tokens that are actually trading today.
- Fully Diluted Valuation (FDV) projects the value if every possible share or token were issued.
- Use market cap for short‑term sentiment and liquidity checks; use FDV for long‑term dilution risk and growth scenarios.
- Both numbers can be misleading if you ignore token‑omics, option exercise assumptions, or vesting schedules.
- Tracking the gap between the two over time often reveals upcoming supply shocks before the market reacts.
What Exactly Is Market Capitalization?
When evaluating a publicly traded asset, Market Capitalization is the total market value of all currently outstanding shares, calculated by multiplying the share price by the number of shares in circulation. In the crypto world the same formula applies, but “shares” become “tokens” and the count used is the circulating supply. For example, if a stock trades at $50 and 100million shares are outstanding, the market cap equals $5billion.
Fully Diluted Valuation Explained
In contrast, Fully Diluted Valuation is the theoretical market value if every possible share or token that could exist were issued. In equities this includes in‑the‑money stock options, warrants, convertible debt, and any other securities that could become common stock. In crypto it means the maximum token supply, regardless of how many tokens are currently circulating. The basic equation is:
FDV = Maximum Supply × Current Price per Token (or Share)
Using Bitcoin as an example, a price of $28,204.75 multiplied by its 21million maximum supply yields an FDV of roughly $592billion-significantly higher than its market cap, which only counts the 19.3million coins already in the hands of traders.
Why the Two Numbers Diverge
The gap between market cap and FDV exists because not every potential share or token is in the market today. In traditional equity, companies often grant stock options to employees. Those options are counted in FDV because, if exercised, they will create new shares and dilute existing owners. In crypto, many projects lock a large portion of their tokens for future development, team incentives, or ecosystem growth. Those locked tokens raise the FDV but leave the current market cap unchanged.
When the locked supply starts to unlock, the market usually reacts-sometimes with a price drop (due to increased supply) or a rally (if the unlock signals growth). Knowing the schedule of future releases lets you anticipate these moves.
How to Calculate Both Metrics - Step by Step
- Gather the price. Use the latest price from a reliable exchange or data provider.
- Find the circulating supply. For stocks, this is the number of shares outstanding as reported in the most recent 10‑K or 10‑Q. For tokens, look at the “circulating supply” field on sites like CoinGecko.
- Calculate market cap. Multiply price by circulating supply.
Market Cap = Price × Circulating Supply
- Identify the maximum supply. Stocks: add outstanding shares plus all in‑the‑money options, warrants, and convertibles (use the treasury method to estimate exercise likelihood). Tokens: use the token’s defined hard cap or maximum emission schedule.
- Calculate FDV. Multiply price by maximum supply.
FDV = Price × Maximum Supply
In practice, most data platforms already display both numbers, but understanding the underlying math helps you verify the figures and spot anomalies.
When to Trust Market Cap
Market cap shines in scenarios where you need a quick snapshot of current market size or liquidity. It’s the metric most analysts use to:
- Rank assets within a sector (e.g., “large‑cap tech” vs “mid‑cap biotech”).
- Gauge trading volume relative to size-high market cap with thin volume may signal low price impact.
- Assess short‑term risk: large‑cap stocks tend to be less volatile than small‑cap ones, and large‑cap crypto tokens often have deeper order books.
Because market cap ignores dormant shares or locked tokens, it can sometimes paint an overly optimistic picture of a project’s scale-especially in early‑stage crypto assets where only a fraction of the total supply is released.
When Fully Diluted Valuation Matters Most
FDV is the go‑to metric for long‑term, fundamentals‑focused investors. It helps you answer questions like:
- How much dilution could happen if all employee options are exercised?
- Will a token’s future unlocks double the supply and halve the price, assuming demand stays constant?
- Is the current market cap artificially high because the majority of tokens are still locked?
In equity research, fully diluted earnings per share (EPS) uses the same principle-accounting for every potential share to get a realistic profitability picture. In crypto, FDV lets you compare projects with wildly different token release schedules on a level playing field.
Common Pitfalls and How to Avoid Them
Even seasoned investors slip up when interpreting these numbers. Here are the most frequent mistakes and practical fixes:
- Ignoring vesting schedules. A project may list a max supply of 1billion tokens, but if 700million are locked for five years, the short‑term FDV is largely theoretical. Review the tokenomics whitepaper or the company’s option grant schedule.
- Treating all options as dilutive. Not every stock option will be exercised-out‑of‑the‑money options expire worthless. Use the treasury method (assumes options are exercised only when the option price is below the market price) to estimate realistic dilution.
- Relying on a single data source. Different exchanges may report slightly different circulating supplies due to timing or classification differences. Cross‑check at least two reputable sources.
- Overlooking token burns. Some projects regularly destroy tokens, reducing max supply over time. Adjust FDV calculations to reflect net supply after burn events.
- Confusing market cap with enterprise value. Market cap ignores debt, cash, or other balance‑sheet items. For a full picture of a company’s worth, combine market cap with debt and cash to calculate enterprise value.
Practical Use Cases Across Markets
Below is a quick look at how traders, long‑term investors, and analysts apply both metrics in real‑world scenarios.
| Stakeholder | Primary Metric | Why It Matters |
|---|---|---|
| Day Trader (Equity) | Market Cap | Liquidity and price impact; large‑cap stocks move less on small orders. |
| Venture‑backed Crypto Investor | FDV | Assess future dilution from token releases and team allocations. |
| Corporate M&A Analyst | Fully Diluted Equity Value | Determine purchase price when all convertible securities are assumed exercised. |
| Portfolio Manager (Mixed Assets) | Both | Balance short‑term exposure (market cap) with long‑term risk (FDV). |
Tracking the Gap Over Time
One of the most insightful charts you can build is a “dilution gap” graph: plot market cap and FDV over the same period and watch the distance widen or shrink. A widening gap usually signals upcoming supply events-think employee option expiration windows, token unlock dates, or scheduled token burns. A narrowing gap often means the market is pricing in future dilution already.
Tools like Excel, Google Sheets, or more sophisticated platforms (e.g., Bloomberg for equities, Dune Analytics for crypto) can pull historical price and supply data and compute the two lines automatically.
Future Trends: Beyond Simple Caps
As markets mature, investors are demanding even richer metrics. Some emerging ideas include:
- Adjusted FDV. Subtracts tokens earmarked for burn or treasury holdings that are unlikely to enter circulation.
- Liquidity‑adjusted market cap. Weights market cap by average daily volume to highlight truly tradable value.
- AI‑driven dilution forecasts. Machine‑learning models ingest option grant schedules and tokenomics events to predict price impact weeks in advance.
These extensions still rest on the core concepts of market cap and FDV, so mastering the basics remains essential.

Frequently Asked Questions
What’s the difference between market cap and enterprise value?
Market cap measures only the equity value of a company (share price×shares outstanding). Enterprise value adds debt, subtracts cash, and includes minority interests, giving a fuller picture of total company worth.
How do I know if a crypto project's FDV is realistic?
Check the token’s whitepaper for vesting schedules, lock‑up periods, and any planned token burns. Compare the listed maximum supply with the amount that will be released over the next 12‑24months; if most tokens stay locked, the FDV is a long‑term theoretical number rather than a near‑term reality.
Can market cap ever be higher than FDV?
Only in rare cases where a company’s share price skyrockets after a massive buy‑back that reduces total shares below the original maximum. In crypto, it could happen if a token’s supply is capped lower than the initially announced maximum due to a protocol‑level burn.
Why do analysts use the treasury method for options?
The treasury method assumes that only in‑the‑money options (where the strike price is below the current share price) will be exercised. It adds the net new shares that would result after the company uses the cash from exercised options to buy back shares, giving a more realistic dilution estimate.
Should I use market cap or FDV for portfolio weighting?
A balanced approach works best. Use market cap to gauge current liquidity and exposure, then overlay FDV to understand how much future dilution could erode that exposure. Many multi‑asset funds cap both metrics at a similar level to avoid over‑weighting assets with huge theoretical supplies.


Market cap feels like the headline act, but FDV is the shadow that looms over every token launch, ready to steal the spotlight when the hidden supply finally shows up.
Investors who ignore that gap are basically walking into a drama they never scripted.
Stop treating market cap like the only truth-FDV tells you how much dilution is waiting in the wings, and if you don’t factor it in you’re just gambling with half the numbers.
When you stare at a market cap, you’re looking at a snapshot, a still frame of a living organism that’s constantly growing, shedding, and reinventing itself.
But the fully diluted valuation is the movie trailer, the preview of everything that could be, assuming every token, every option, every warrant decides to join the party.
The philosophical tension between the two is akin to the age‑old debate of being versus becoming, where market cap is the present self and FDV is the projected future self.
In practical terms, this means that a token with a $2 billion market cap and a $10 billion FDV carries a dilution risk that could, in theory, wipe out five‑fold of its current value if the supply unlocks fully.
Yet, that risk is not deterministic; it depends on the vesting schedule, the community’s demand, and the macro‑economic climate that frames investor sentiment.
Imagine a startup that issues stock options to its early employees-those options are a promise of future ownership, a pledge that expands the equity pie when exercised.
Ignore that, and you’ll overestimate the per‑share earnings, just as you’d overestimate a crypto token’s scarcity if you forget the lock‑up cliffs.
Some analysts treat FDV as a doom‑scrolling metric, but a savvy investor sees it as a roadmap, a gauge of potential supply shock that can be hedged or even exploited.
When the gap between market cap and FDV widens, you should ask: why is the future supply so larger, and what does the project intend to do with those tokens?
If the answer is “burn them” or “use them for ecosystem growth,” the FDV may not be as terrifying as the raw numbers suggest.
Conversely, if the project simply hoards tokens in a treasury with no clear utility, that FDV becomes a lurking specter of future price depression.
Historical data shows that assets with massive FDV‑to‑market‑cap ratios often suffer steep corrections once large unlock events occur, unless strong demand materializes simultaneously.
Therefore, the interplay of market cap and FDV is not just a mathematical curiosity; it is a narrative about supply, demand, and the expectations investors place on a team’s future actions.
In short, treat market cap as your immediate reality check and FDV as your long‑term risk assessment, and you’ll navigate both worlds with a clearer mind.
Remember, the numbers are only as useful as the story you weave around them.
Think of market cap as the current size of a pond and FDV as the size it could reach if every rainstorm poured water into it; both give you insight, but only together do they show the full picture of how deep the water really is.
Keeping an eye on both helps you avoid stepping into shallow water that looks deep at first glance.
When you’re building a portfolio, allocate a portion based on market cap to ensure liquidity, and set aside another slice guided by FDV to account for potential dilution.
This balanced approach lets you stay flexible while protecting against surprise supply spikes.
Okay, let’s get into it, shall we?;
Market cap, that’s the easy‑to‑grab number, the one you see on every ticker, the one that screams “I’m worth this right now!”;
FDV, on the other hand, drifts in the background, whispering, “What if every option, every token, every warrant materializes?”;
If you ignore the whisper, you’re basically walking blindfolded into a financial minefield, and that’s a recipe for disaster, plain and simple!;
So, always cross‑check, always calculate the dilution gap, and never let the flashy market cap blind you to the looming FDV.
FDV shows future supply; market cap shows present value.
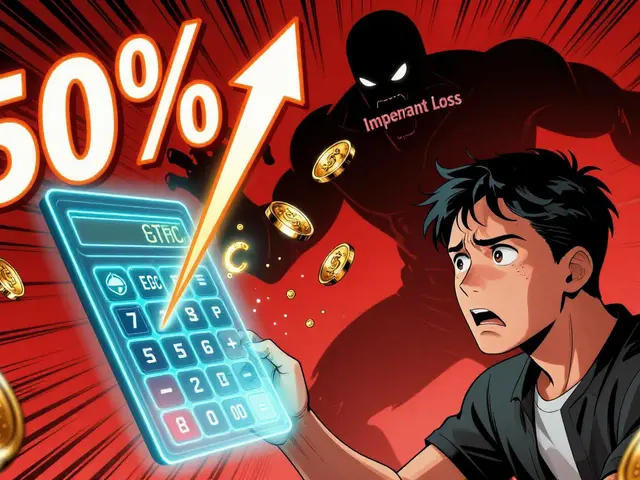
Got the calculator running? 🎉 It’s cool to see the numbers, but remember, the real drama happens when those locked tokens finally hit the market. 🙄 Keep an eye on the gap, or you’ll be left holding a “surprise” that nobody warned you about.
Great info
i think the post does a good job at explanin the diffrence between market cap and fdv but some of the terms are a bit heavy for new comers.
Oh wow, another article telling us to look at both market cap and FDV-who would’ve thought the obvious is actually important?
If you’re unsure which metric to prioritize, start with market cap for liquidity and then layer FDV to gauge long‑term dilution risk; this step‑by‑step method keeps your analysis grounded.
Wow, you really dug deep into the philosophy there! 🤗 It helped me see that the numbers aren’t just cold stats but part of a bigger story about future supply and community trust.